The Visual Display of Quantitative Information


THE visual style book. Turn a page in this finely printed volume and you’ll be treated to another ingenious chart that is at once simple, telling, and beautiful. Flamboyant graphs, particularly those dressing up insensible data, are bad craft: “If the statistics are boring, then you’ve got the wrong numbers.” The rules are like writing well ー do it honest and clear. Tufte gives memorable, handsome examples of how to display information with integrity and clarity. The book is a good example. It’s one that you return to dip into before you pick up graph paper.
[Kevin Kelly, The Essential Whole Earth Catalog p.318]
【コンテンツ】
Part 1. GRAPHICAL PRACTICE
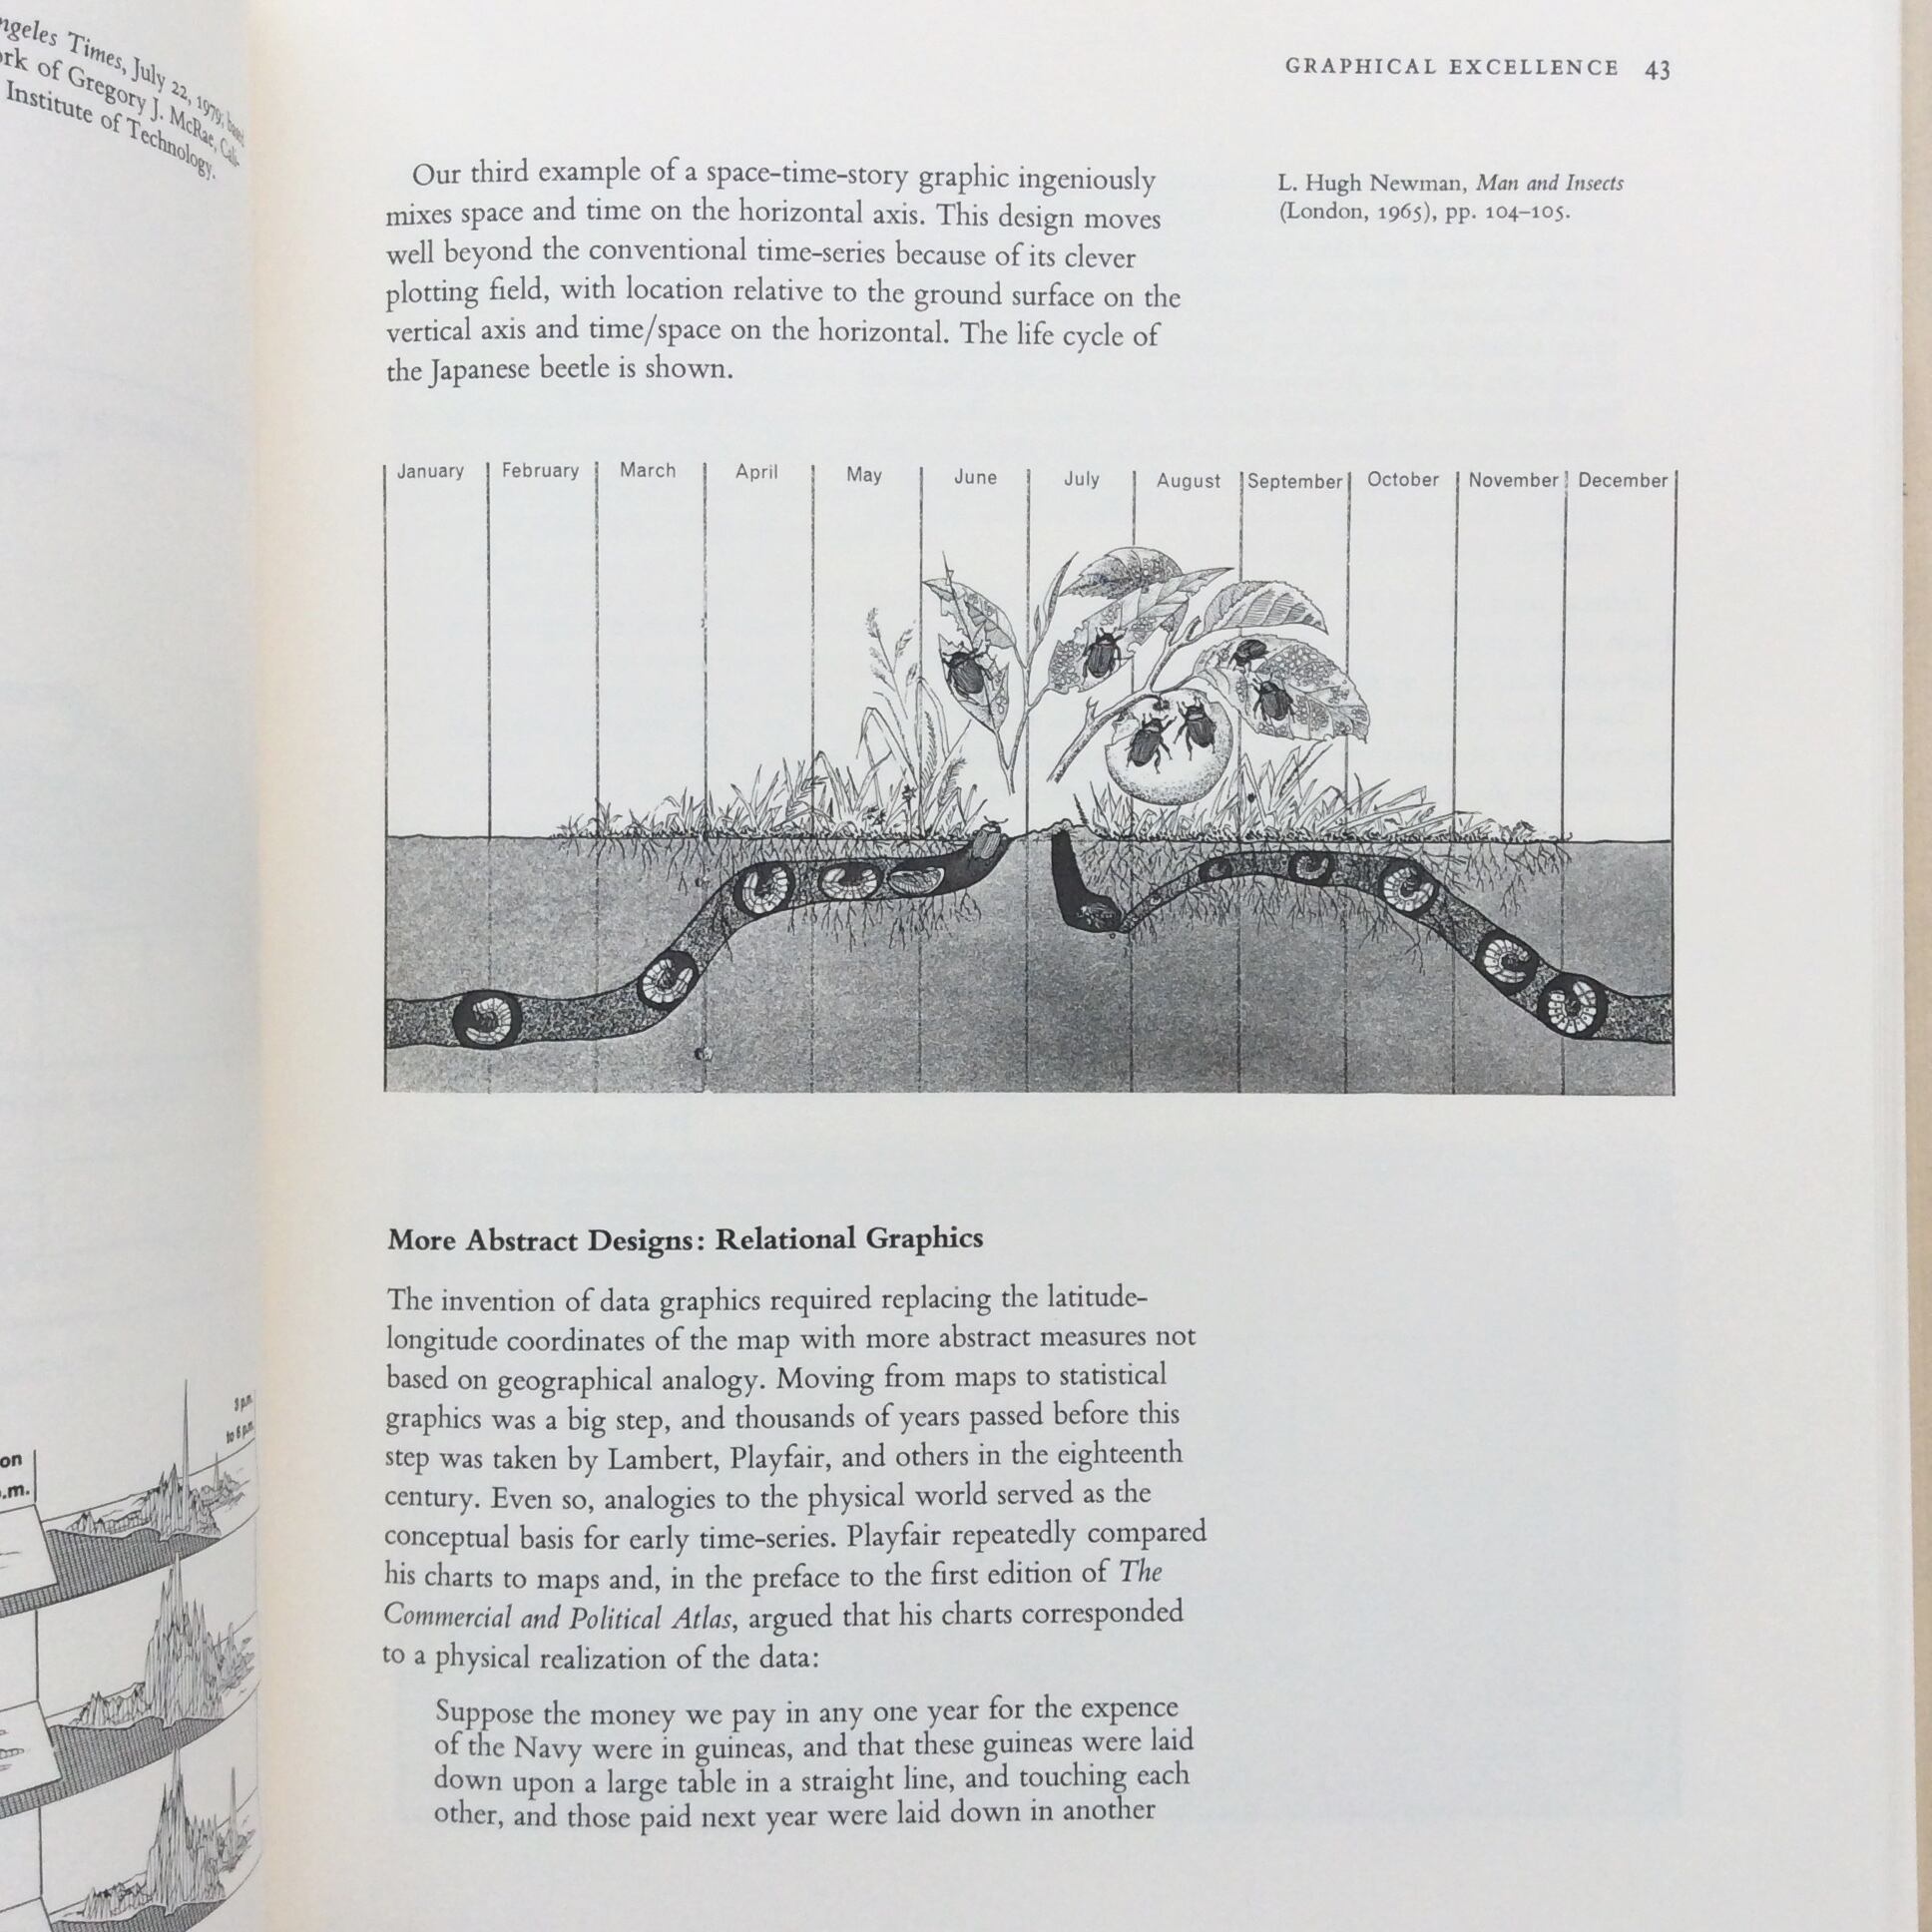
1. Graphical Excellence
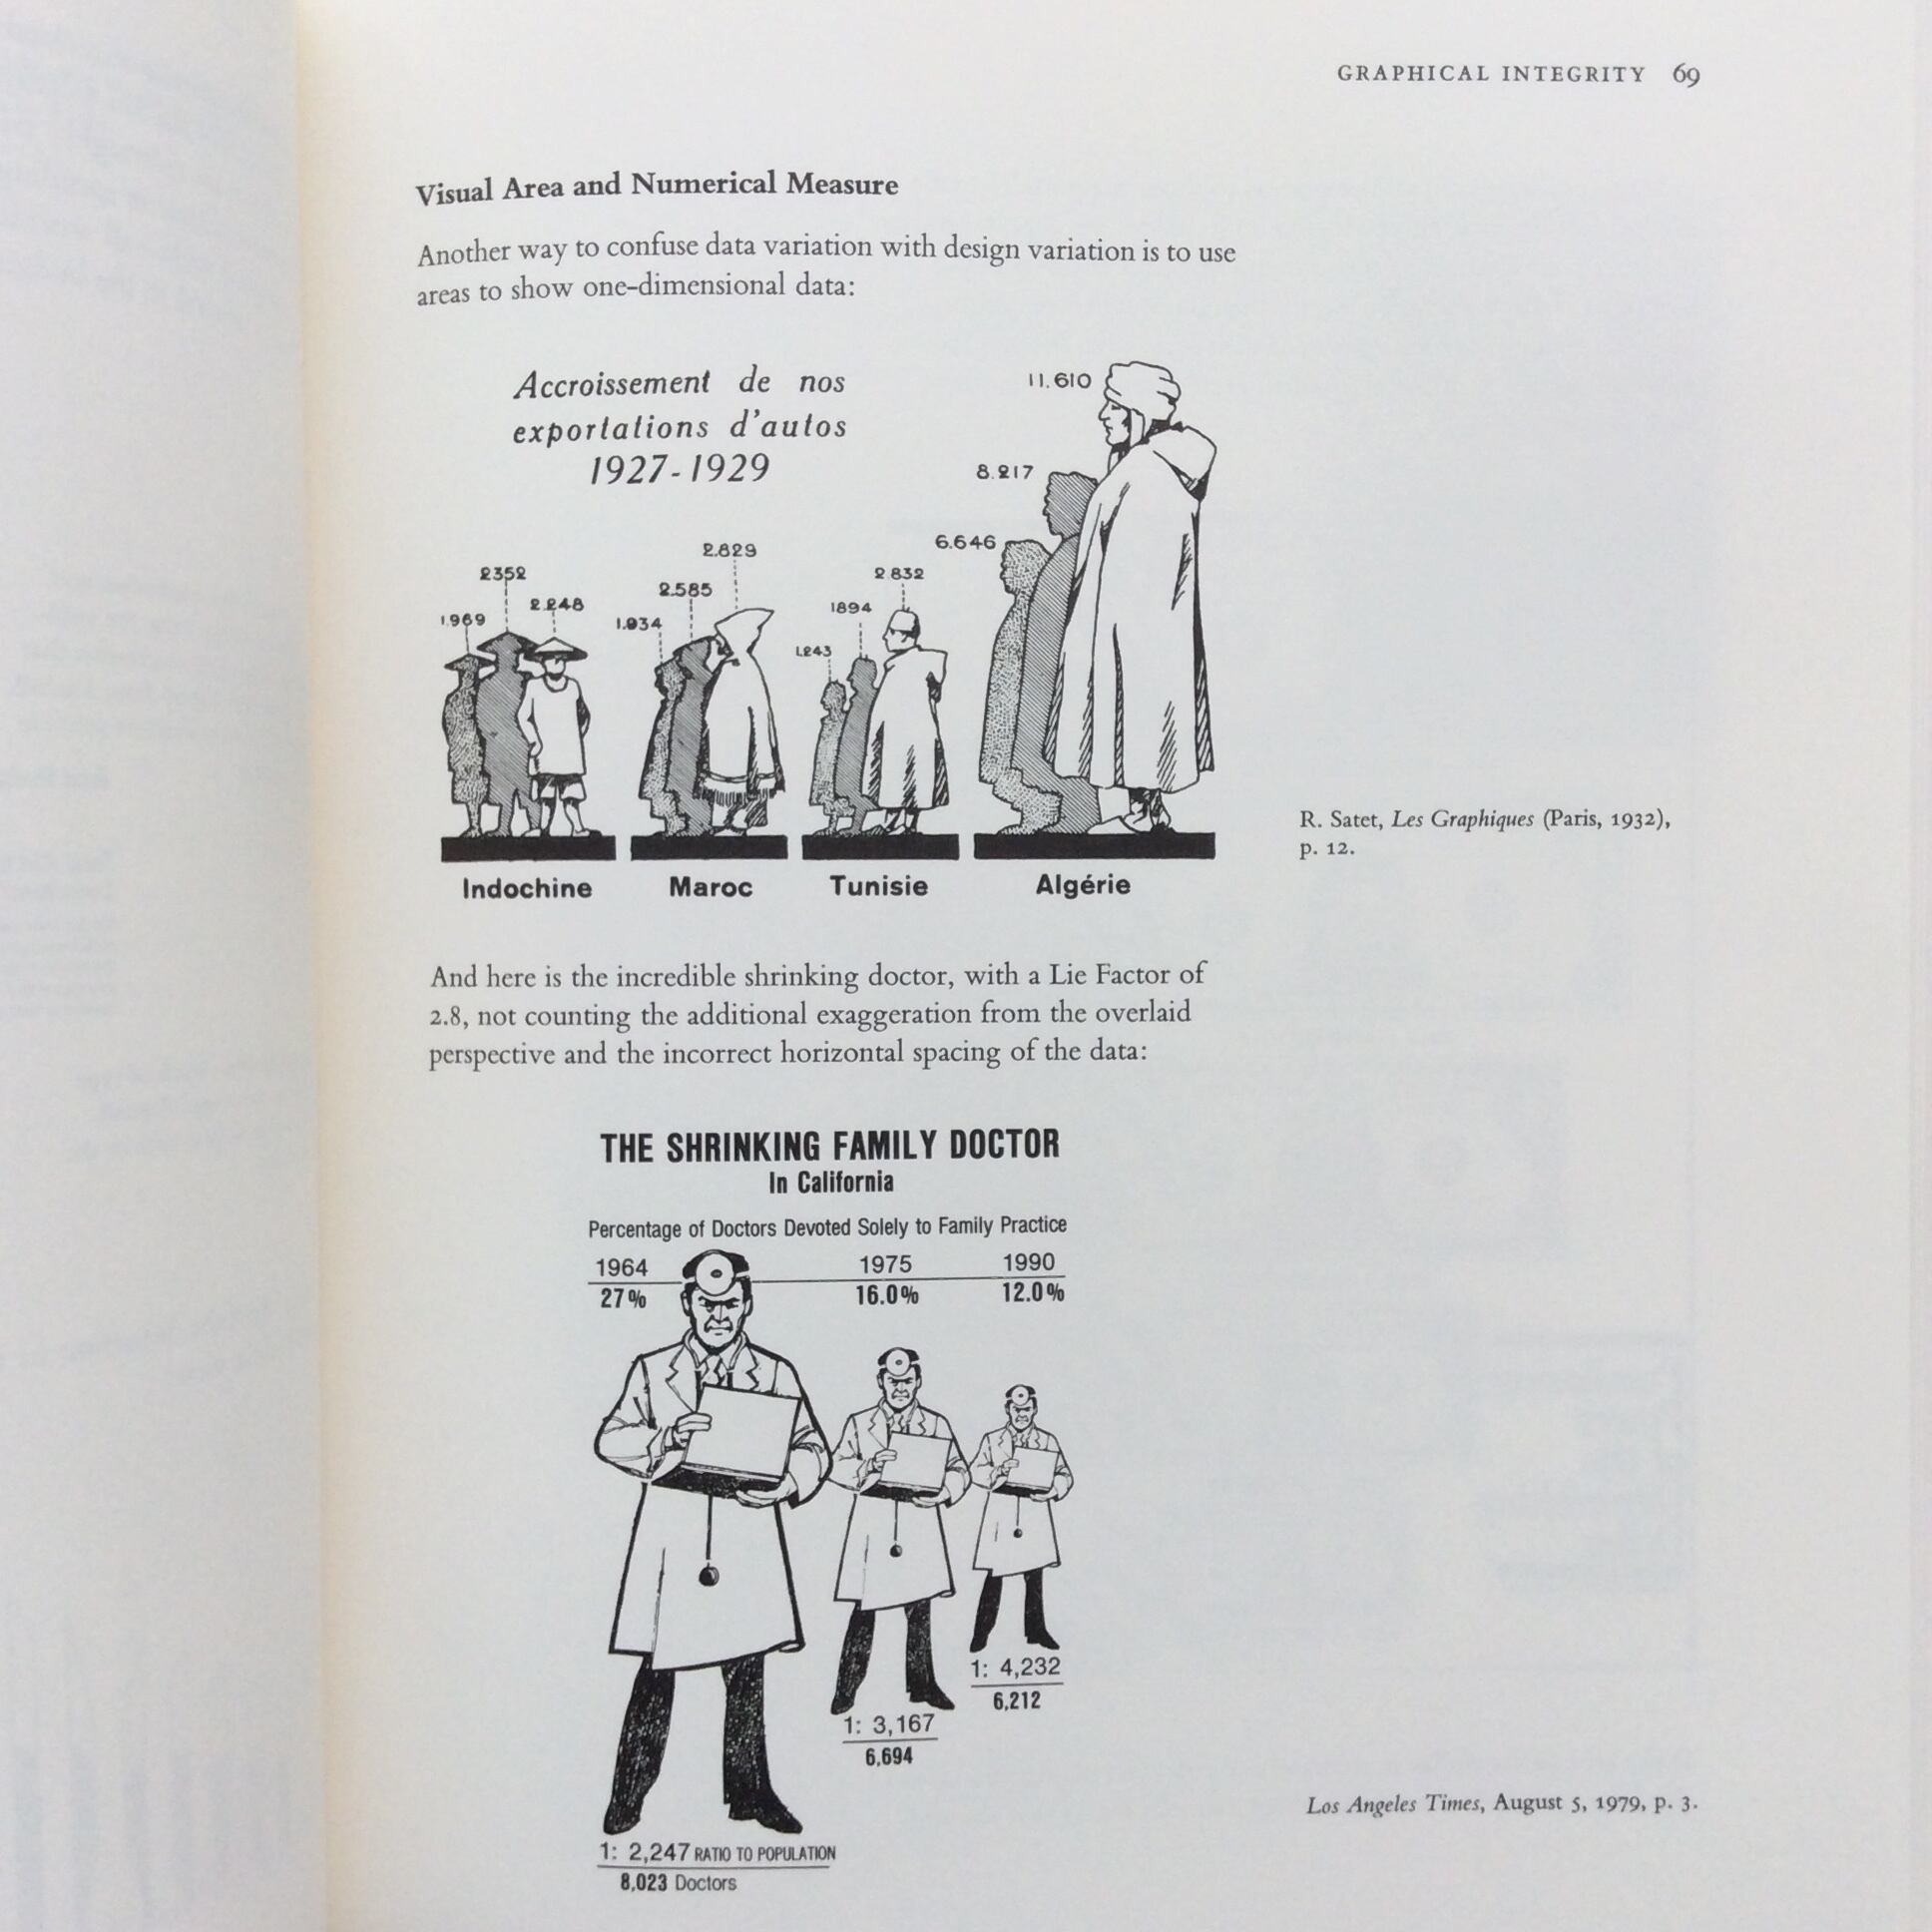
2. Graphical Integrity
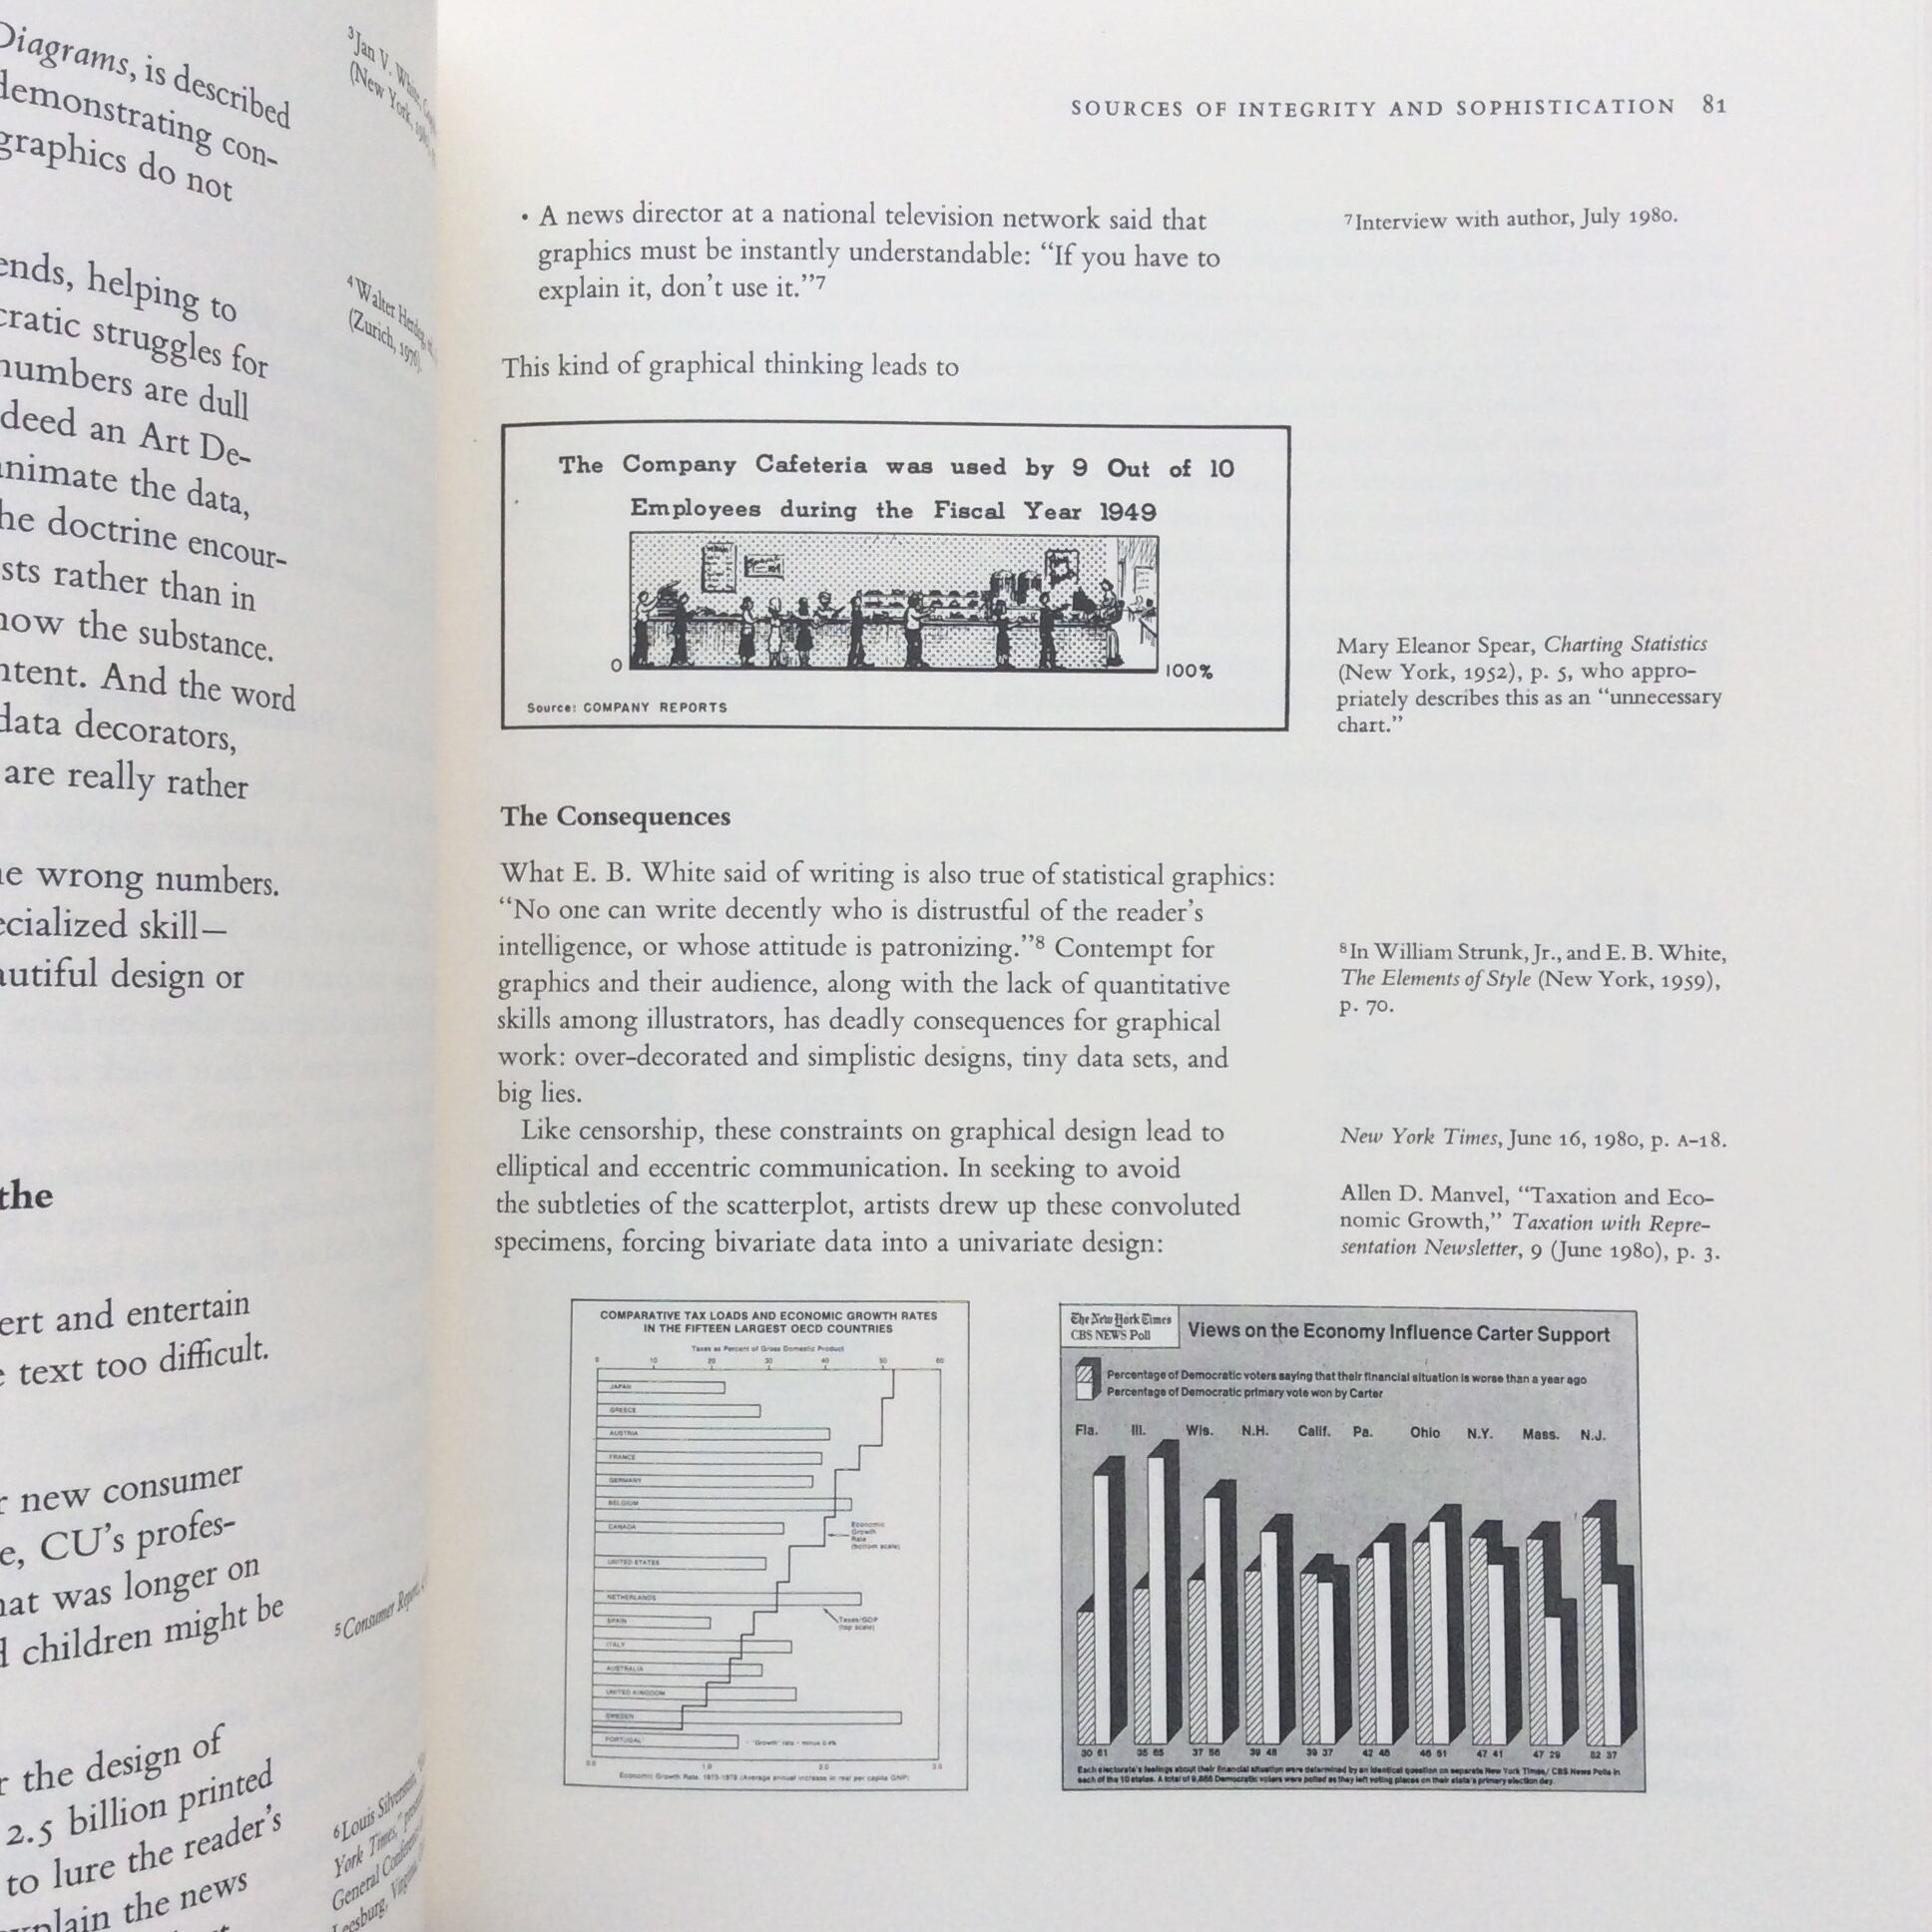
3. Source of Graphical Integrity and Sophistication
Part 2. THEORY OF DATA GRAPHICS
4. Data-Ink and Graphical Redesign
5. Chartjunk: Vibrations, Grids, and Ducks
6. Data-Ink Maximization and Graphical Design
7. Multifunctioning Graphical Elements
8. Data Density and Small Multiples
9. Aesthetics and Technique in Data graphical Design
出版年:1983年
言語:英語
ページ数:198ページ
サイズ:27.5cm×23cm×2cm
【コンディション】
ジャケットに軽微な汚れがあります。